Projects

Some examples of projects I have developed

An emergency mission is a chain: call, dispatch, drive, treatment on scene, transport, handover at the hospital, patient care inside the emergency department, the ambulance's return to service. Performance targets look almost only at the first links. The projects below show that the decisive levers are often further down the chain, and in how people and rules are organised. For each project, one number, chart or table that captures what we learned.

The bigger picture

How an ambulance system really works, and what managers should watch

Measure the whole mission

Response time is necessary but not sufficient. Handover, return to service, destination choice and missions that end without transport decide how many ambulances are really available.

Rules only work if they are applied

One stroke patient in three goes to a different hospital from the one the rule indicates. Monitoring compliance comes before redesigning the network.

Capacity follows the rota, demand does not

Patients arrive smoothly over the day; capacity drops at every shift change. Staggered handovers protect the queue.

Who works matters as much as how many

Contract or employed doctors, volunteers or paid crews: employment models change productivity and resilience, not only cost.

Small frictions, large costs

An imprecise address costs about five minutes; one extra minute of response time costs lives. Logistical fixes upstream can have large returns.

Look after the people

Burnout and secondary trauma concentrate among clinical and experienced staff. Wellbeing is part of service performance.

Projects

Dispatchers often receive imprecise addresses. Comparing the outbound trip (destination uncertain) with the return trip (destination known), on Liguria emergency data, isolates the time lost looking for the patient.

Extra driving time to reach a patient at home, by trip length (minutes) Table: extra minutes of outward driving when the patient is in a dwelling, by total trip distance. 4.64 minutes under 5 km, 4.66 for 5 to 10 km, 4.75 for 10 to 15 km, 4.02 for 15 to 20 km, 3.60 for 20 to 25 km; all significant at 1%, with 24,000 to 91,000 missions per column.
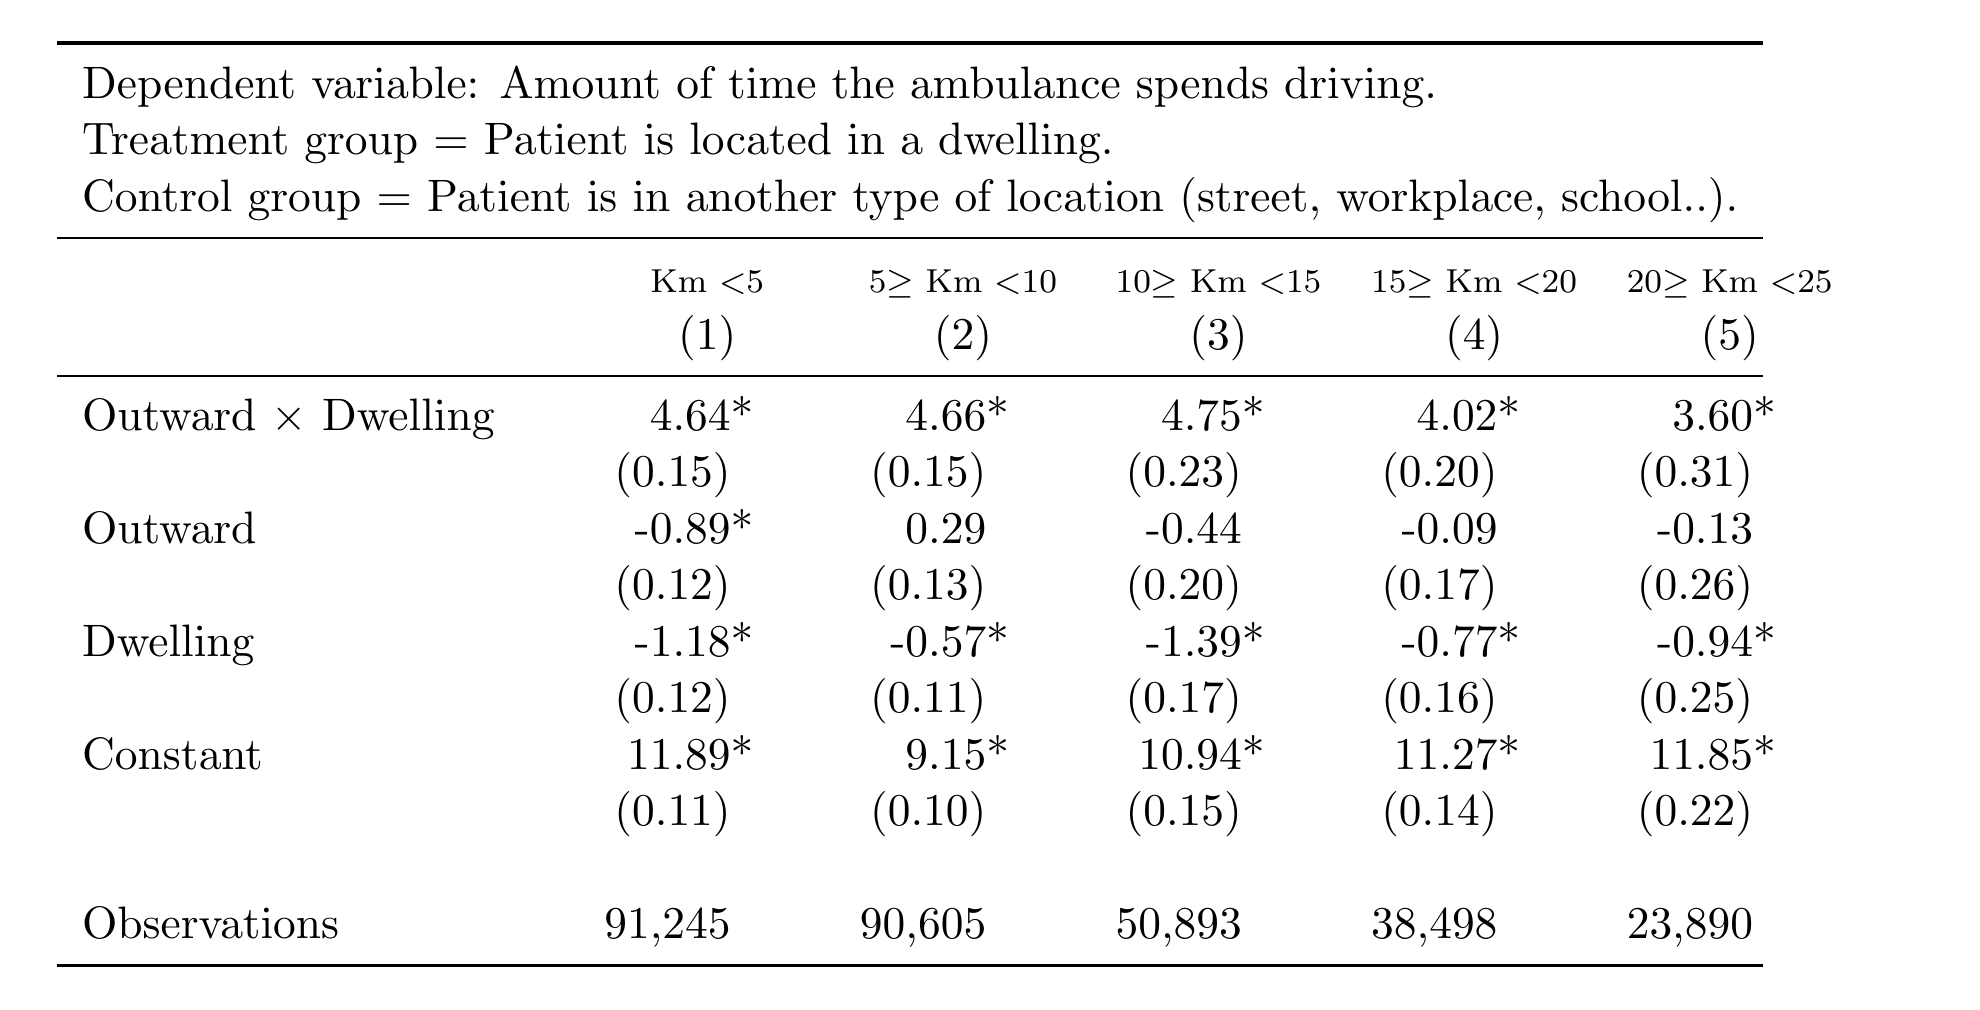
Read the first row: whether the trip is under 5 km or over 20 km, finding a patient at home costs roughly 4 to 5 extra minutes. It is a fixed cost of locating the patient, not a matter of distance; for urgent missions it is about 5 minutes, +30% on driving time.

So whatBetter caller location (handset location, address validation, dispatcher protocols) is one of the cheapest ways to save minutes.
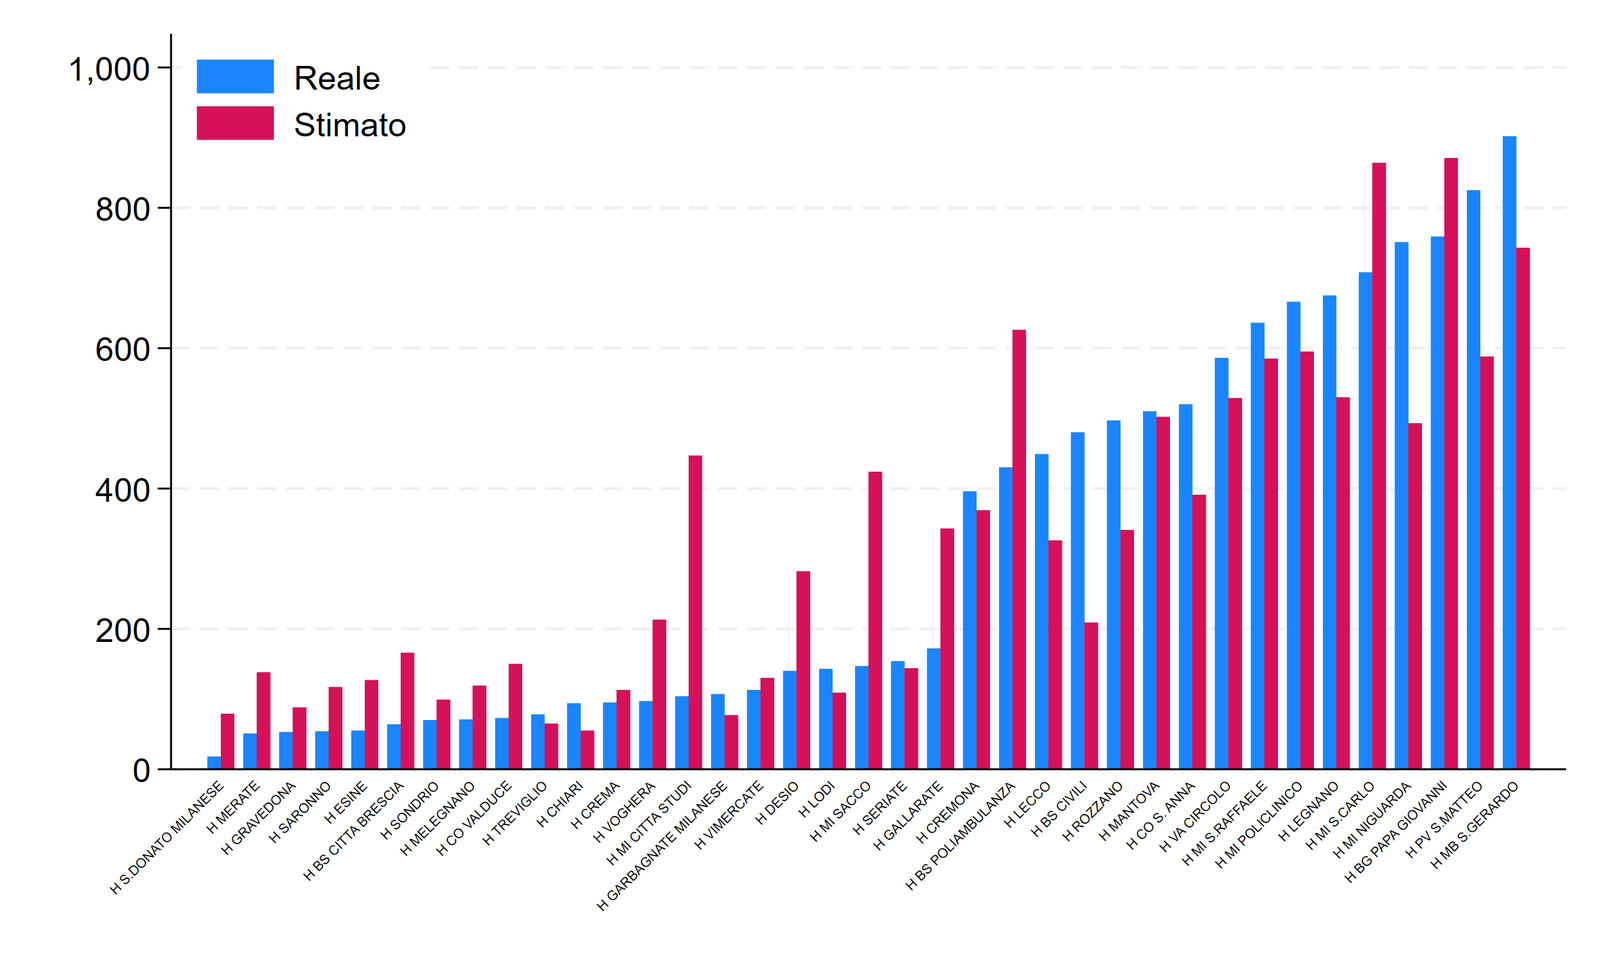
Lombardy has a rule for where ambulances should take stroke patients: the nearest hospital of the right level within 45 minutes' drive. The region is now reclassifying hospitals and considering a new rule. Before changing the rule, I checked whether the current one is followed. For every patient I estimated the drive time to each of 37 hospitals and computed where the rule would have sent them.

32.7%

of patients went to a different hospital from the one the current rule indicates (3,940 transports)

104vs 447

Milan Città Studi: patients actually received vs. patients the rule would have sent

Patients per hospital · actual (blue) vs. current rule (red) Bar chart of stroke patients per hospital in Lombardy in 2024. For many hospitals the actual number (Reale, blue) differs widely from the number the current rule would assign (Stimato, red): some receive far fewer, others far more.
Reale = actual destination; Stimato = destination under the rule in force. Drive times estimated on the road network and validated against observed ambulance trips.

So whatOne patient in three does not go where the rule says. Is it worth writing new rules, or changing them, if we do not follow the ones we have? Before redesigning the network, it pays to understand why practice departs from the rule.

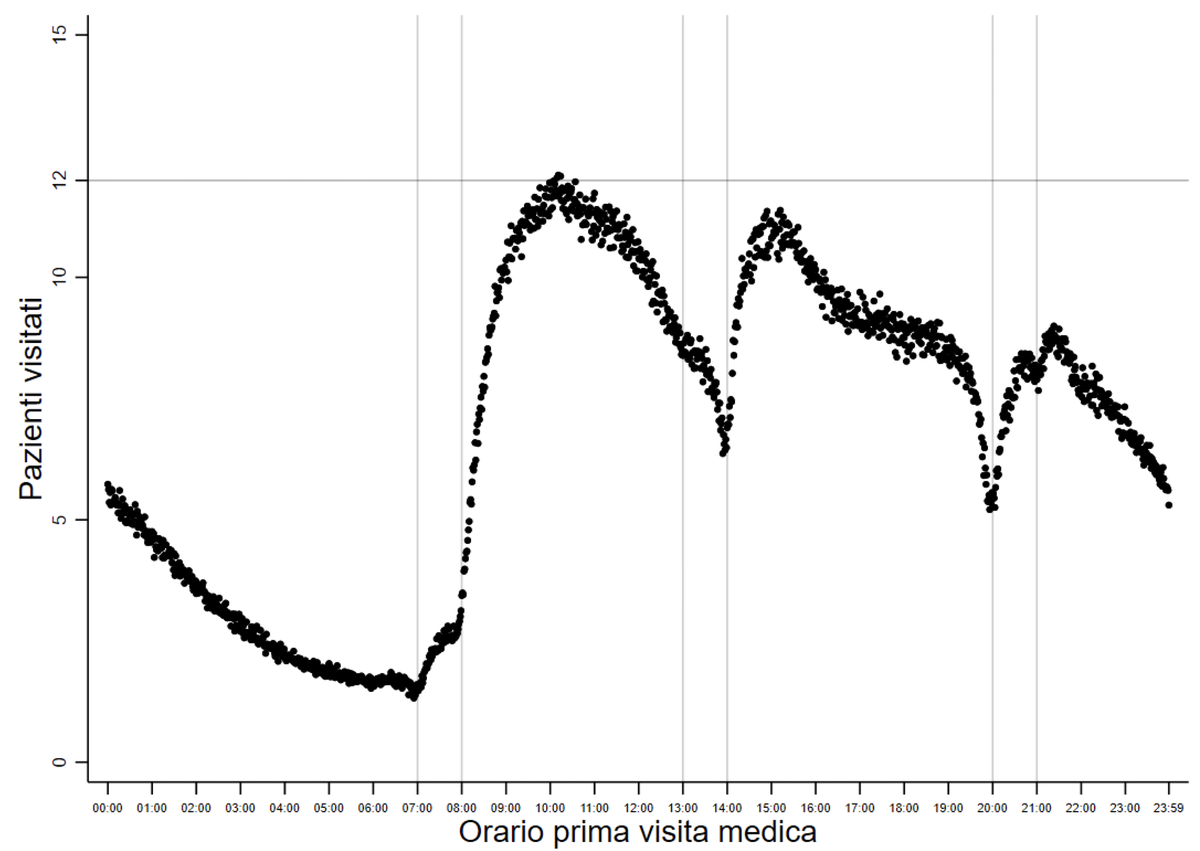
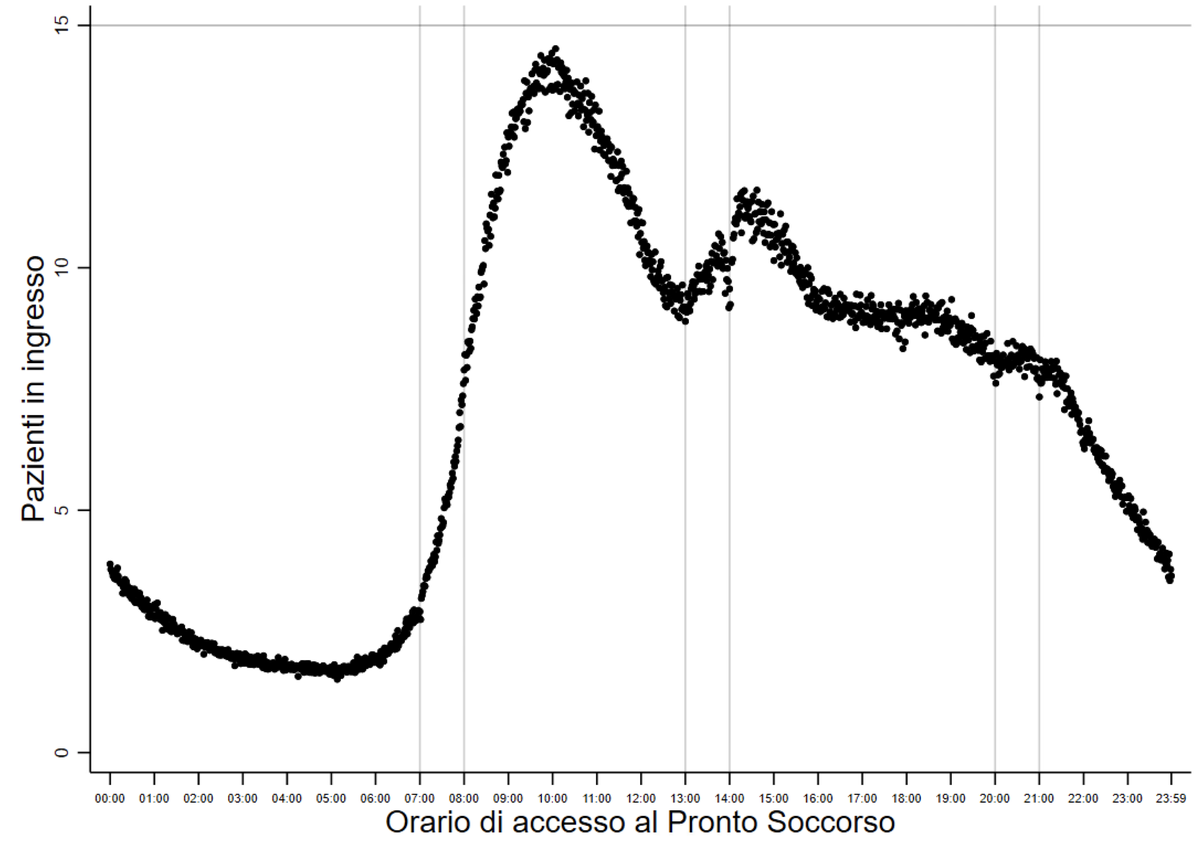
Patients arrive at the emergency department following a smooth daily pattern. Doctors see them following the staff rota. Comparing the two, minute by minute across the whole region, shows where capacity is lost.

a · Patients arriving, per minute Average number of patients arriving per minute across Lombardy emergency departments by time of day: low at night, peak of about 14 around 10:00, second peak around 14:30, then a slow decline.
b · Patients seen by a doctor, per minute Average number of patients seen for the first time per minute by time of day: peak of about 12 around 10:00, with sharp drops at 14:00 and 20:00, at shift changes.

Each dot is one minute of the day, averaged over 2019 across all Lombardy emergency departments. Axis labels in Italian: pazienti in ingresso = arrivals, pazienti visitati = patients seen.

Demand peaks at about 14 arrivals per minute around 10:00, while doctors never see more than about 12. Instead of staying high to clear the queue, capacity collapses at the 14:00 and 20:00 shift changes. Overlapping shifts are not enough to keep the flow going.

So whatStaggering shift handovers and protecting capacity just after the morning peak would cut queues without hiring more doctors.

Hospitals increasingly fill emergency department shifts with contract doctors. Within each shift and treatment area, patients are assigned to doctors quasi-randomly, which allows a causal comparison of the two groups on the same kind of patients.

+24% time

at least, to treat and discharge a patient

+7% cost

at least, on tests and treatments

0gain

no detectably better patient outcomes

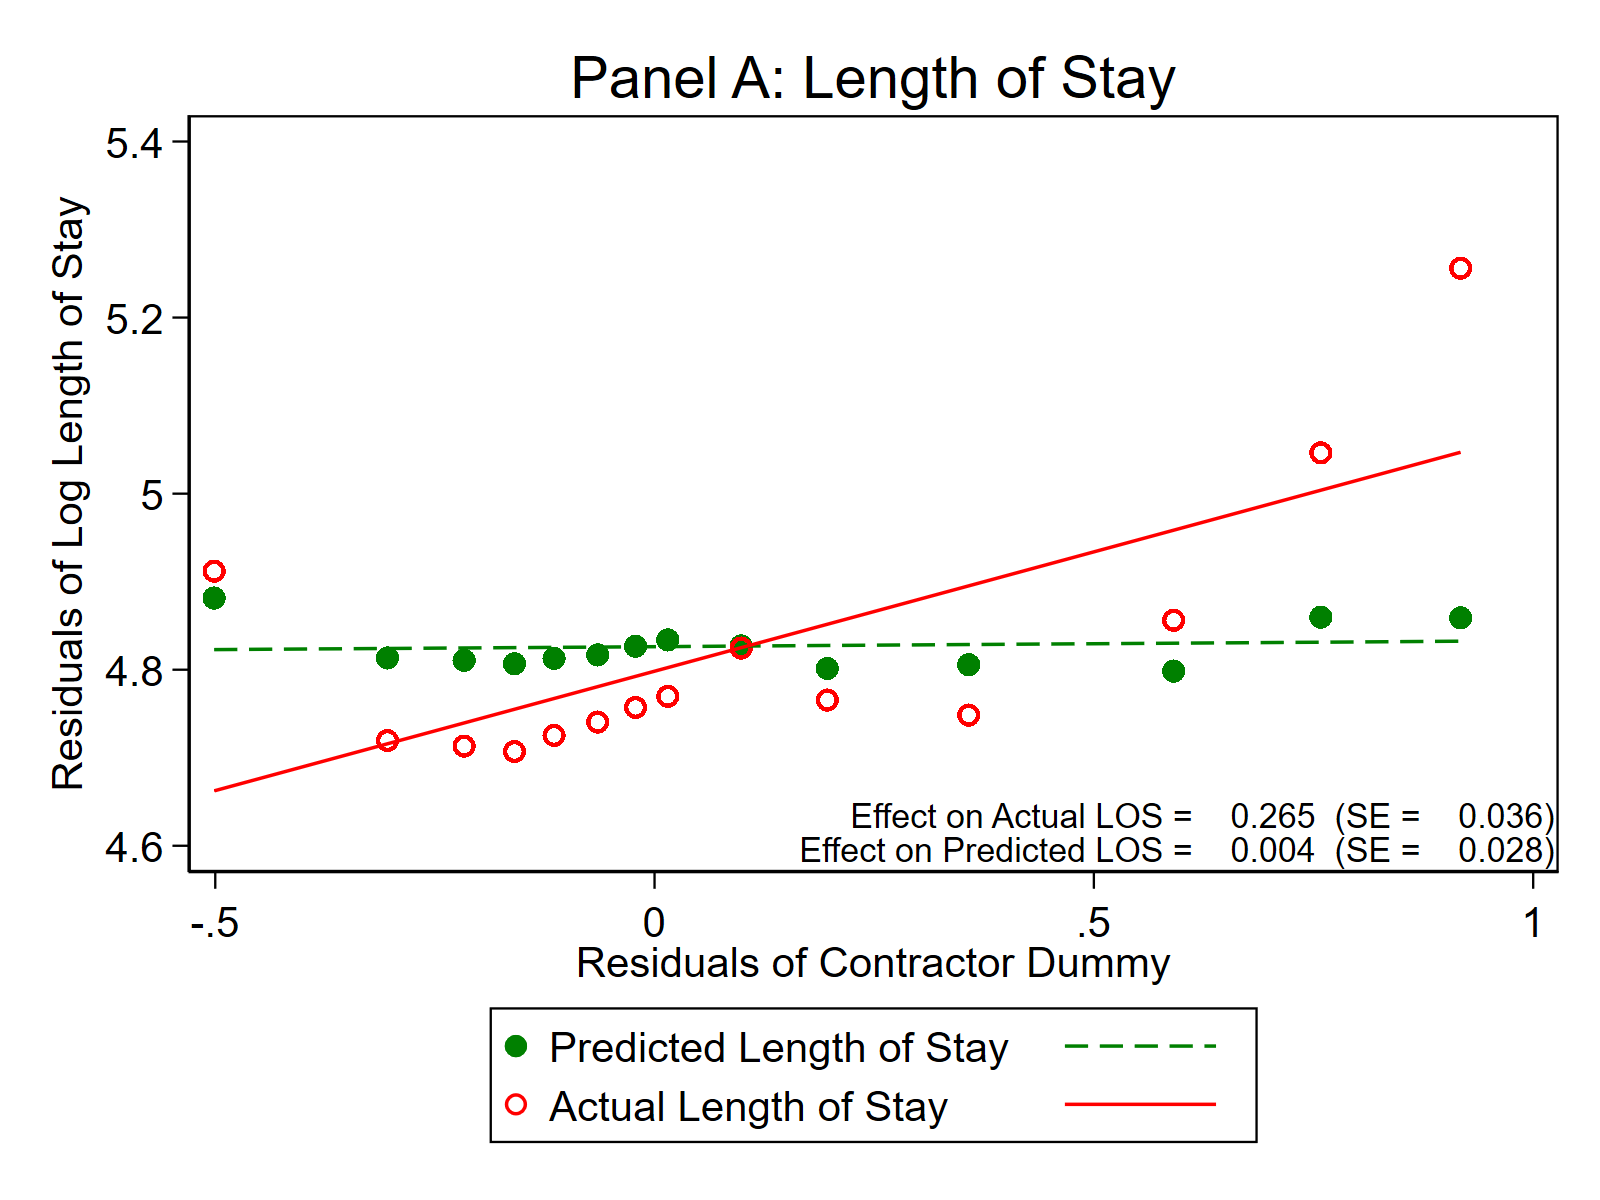
Balance test · predicted vs. actual length of stay Binned scatter plot against contractor status. Predicted length of stay, based on patient characteristics, is flat (effect 0.004, SE 0.028). Actual length of stay rises steeply (effect 0.265, SE 0.036).
We predict each patient's length of stay from what is known at arrival (age, sex, triage, complaint, mode of arrival, referral). Contractors do not receive patients who should take longer (flat green line), yet their patients actually stay longer (red line). The gap is about how cases are managed, not which cases are assigned. All variables residualised on shift-by-area indicators.

So whatThe gap comes from employment status, not from who is hired: employees put in extra effort for fellow employees, but not for contractors. Staffing contracts shape team behaviour and productivity, not only cost.

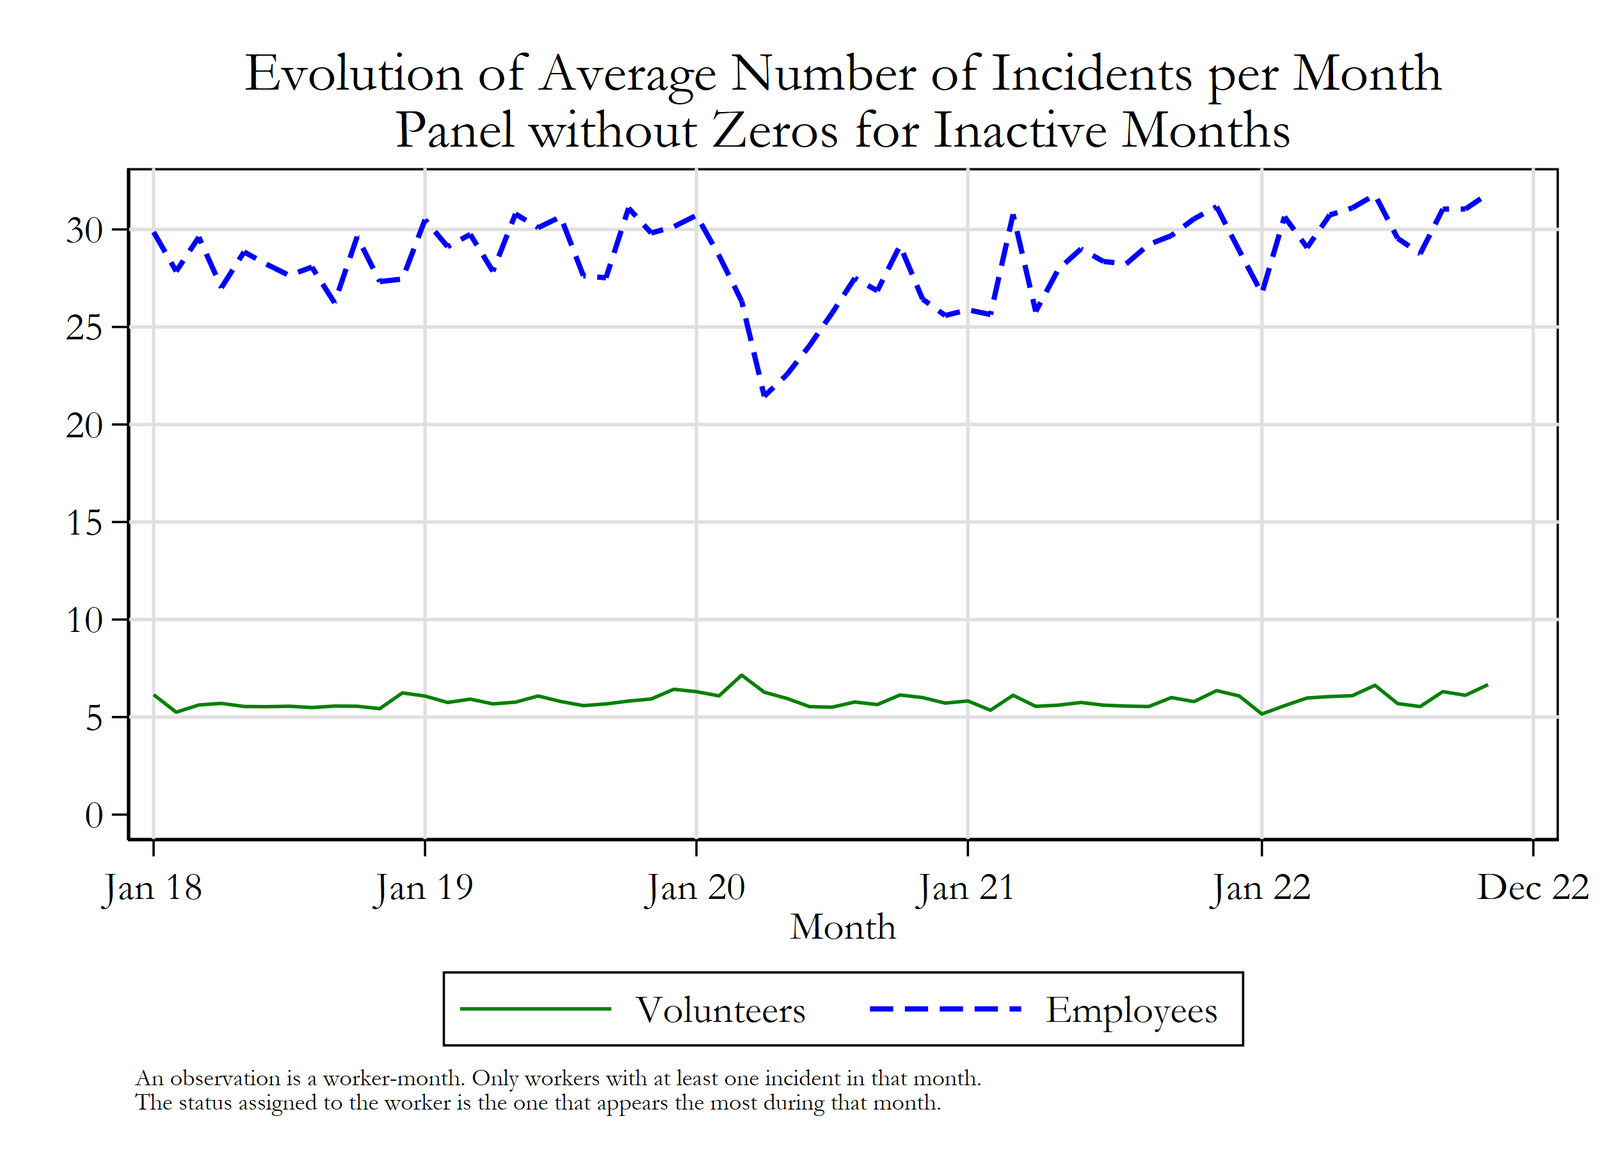
In Lombardy, ambulances are run by non-profit organisations, and employees and volunteers do exactly the same job on board: driver, crew leader, rescuer. Following every worker month by month shows how each group responded to the pandemic shock.

≈ −30%

employees: from about 30 to about 21 missions per month in spring 2020

≈ 6steady

volunteers: missions per month unchanged, even slightly up at the start of the pandemic

Average missions per worker per month · active workers Line chart, January 2018 to December 2022. Employees (blue dashed) average about 28 to 31 missions per month, dropping to about 21 in spring 2020 and recovering by 2021. Volunteers (green) stay flat at about 5 to 7 missions per month throughout, with a small rise in early 2020.
An observation is a worker-month; only workers with at least one mission in that month.

So whatVolunteers are a small but resilient share of capacity: when the system was under the greatest stress, their presence did not shrink. Emergency planning should count on them as a stabiliser, not only as extra hands.

Rain slows ambulances for reasons unrelated to the patient's condition. Using rainfall as a natural experiment, I estimate the causal effect of response time on mortality from cardiac events.

+1min

of average response time

105deaths / year

additional deaths in one Italian region

So whatCutting even one minute through vehicle positioning, dispatch speed or routing has a large, measurable return.

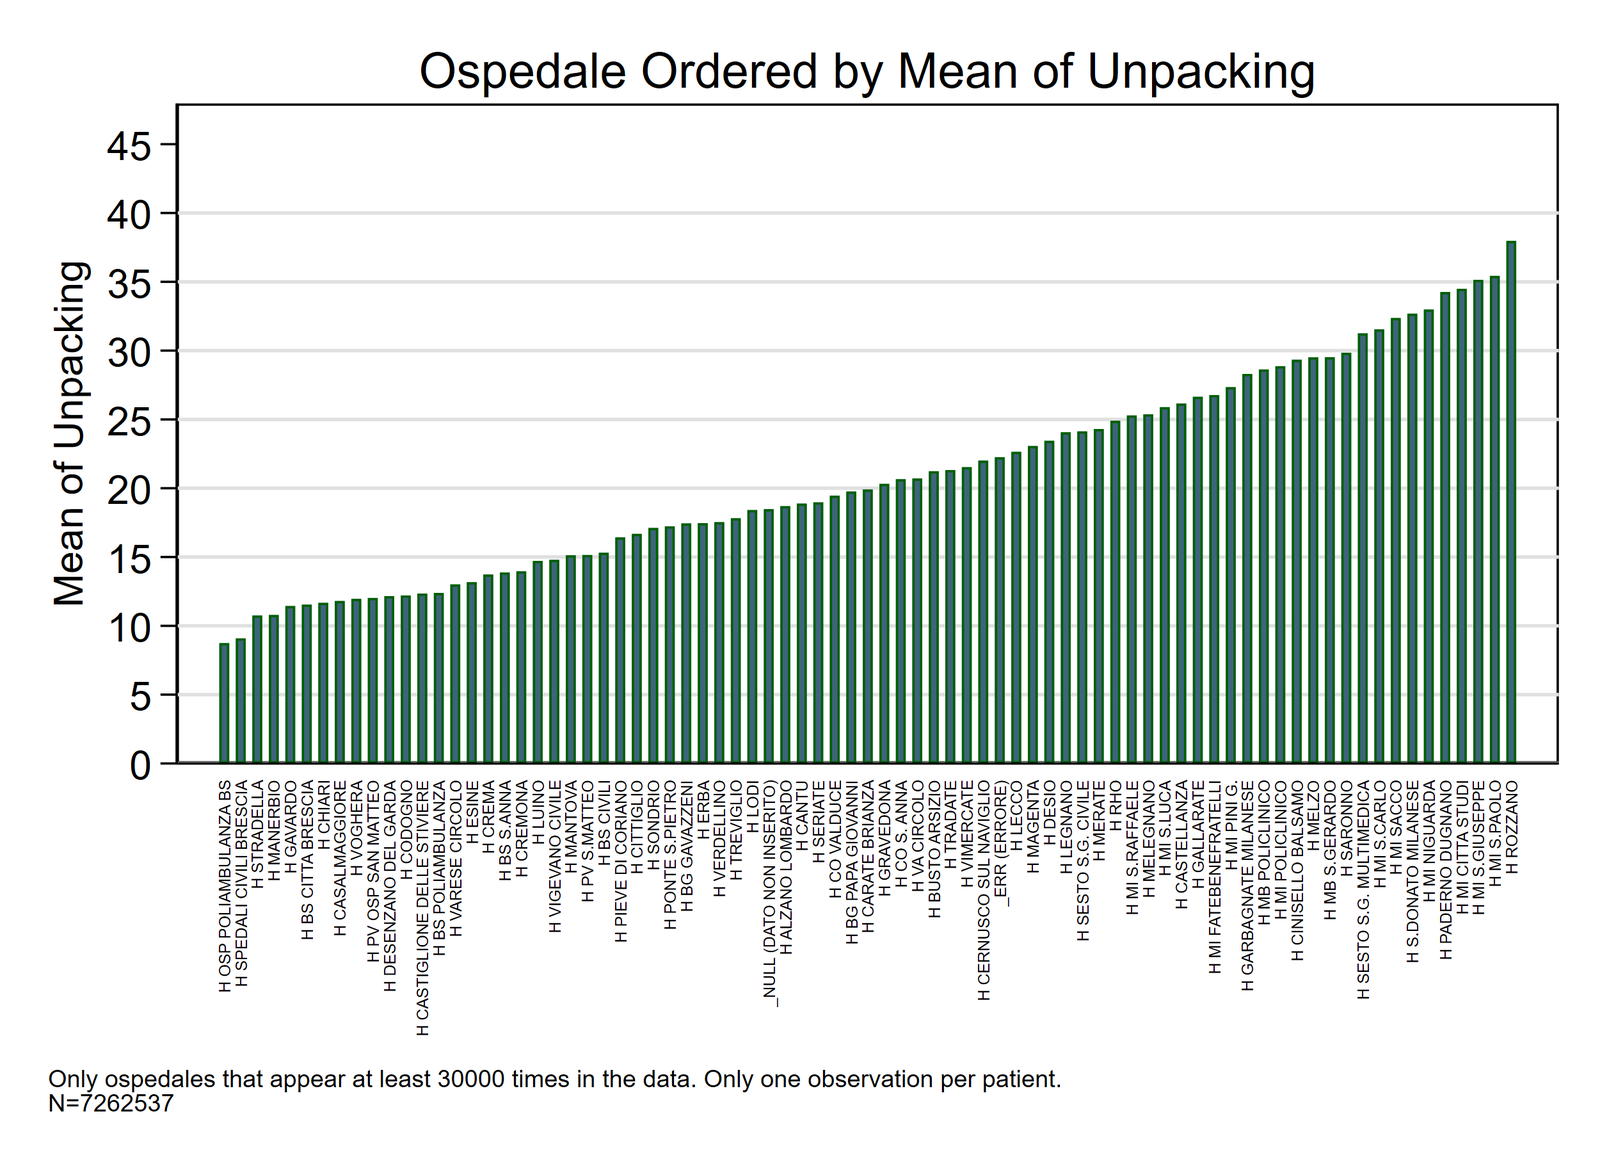
Ambulance services are judged on response time. But once the ambulance reaches the emergency department, the crew must wait until the patient is taken over by hospital staff. Until then the vehicle is blocked and cannot answer the next call. In Lombardy this handover takes 21 minutes on average, and it varies hugely from one hospital to another.

21min

average handover time at the emergency department

9→38min

from the fastest to the slowest hospital

Average ambulance handover time by hospital (minutes) Bar chart of Lombardy hospitals ordered by mean ambulance handover time, rising from about 9 minutes at the fastest hospitals to about 38 minutes at the slowest.
Hospitals appearing at least 30,000 times in the data; one observation per patient.

So whatEvery minute an ambulance waits at the hospital is a minute it is not available. Where handovers are slow, more vehicles and crews are needed to guarantee the same response times. Fleet sizing and hospital emergency department capacity must be planned together.

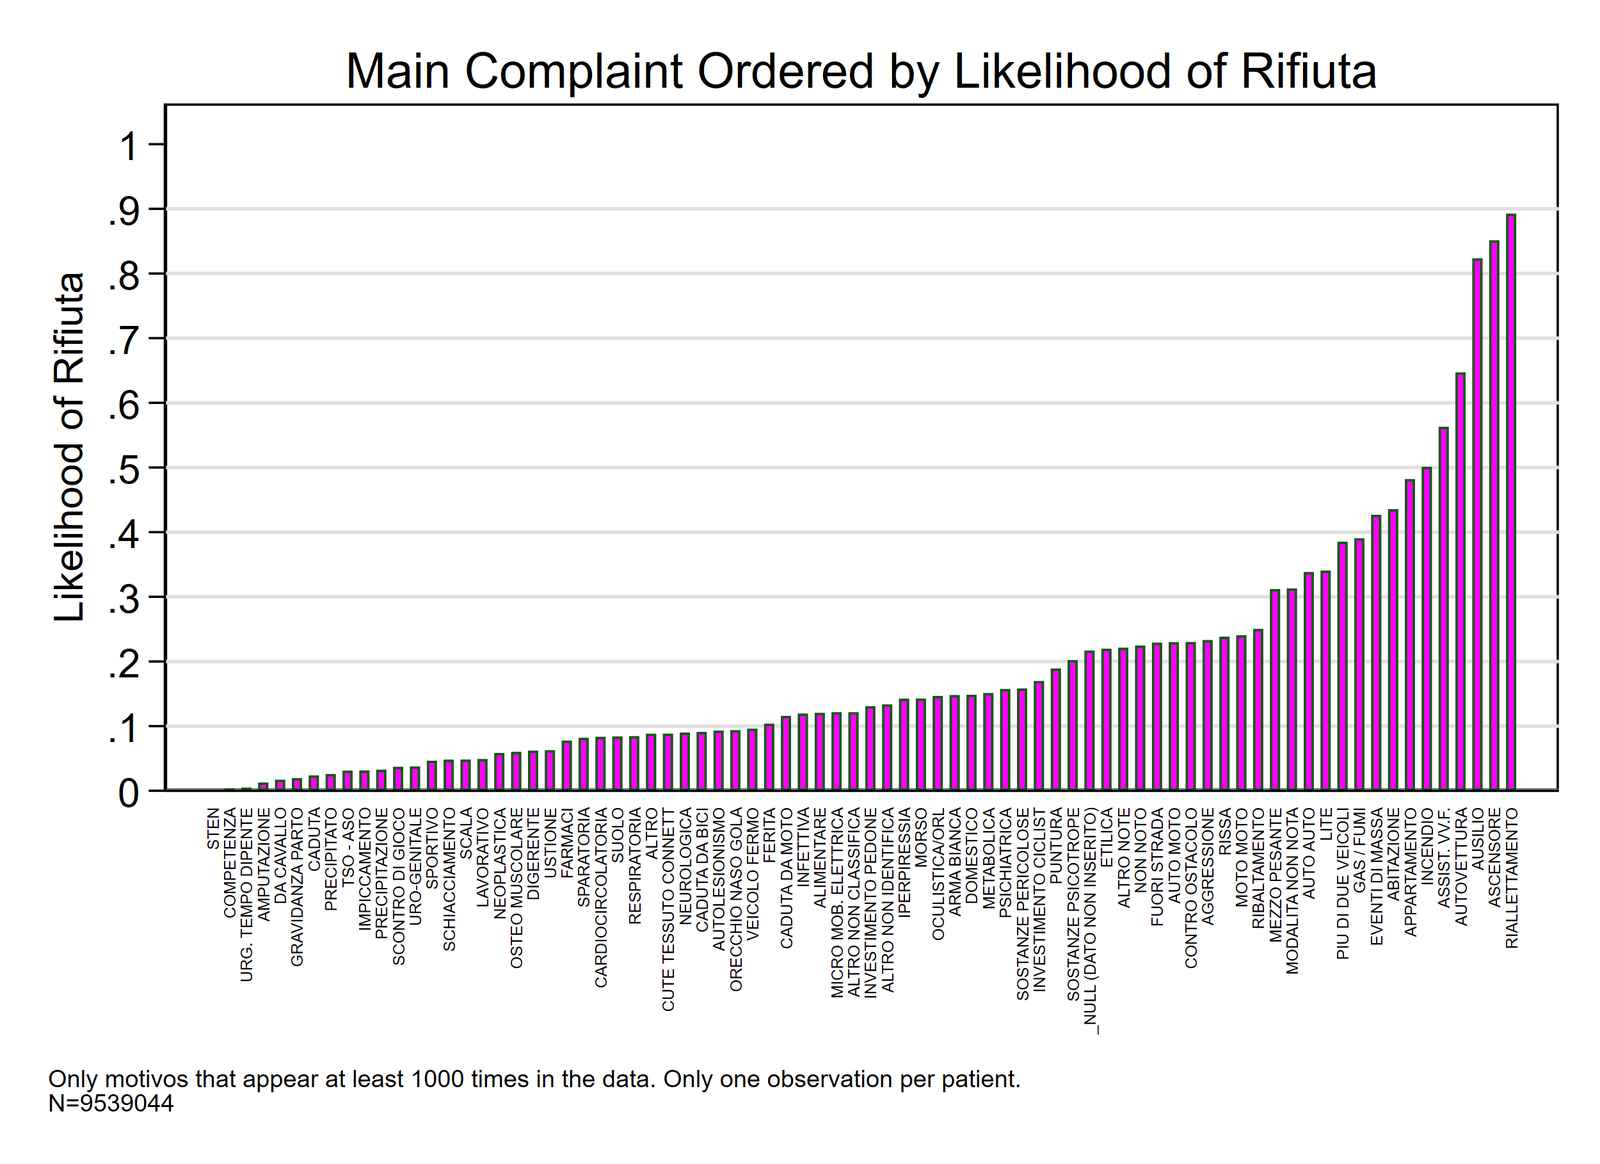
In 11% of missions the patient refuses transport to hospital. Was an ambulance the right response? The refusal rate depends heavily on the reason for the call: it is close to zero for time-critical emergencies, but very high for calls that are not really medical emergencies.

11%

of ambulance missions end with the patient refusing transport

≈ 0%

for time-critical conditions, amputations, childbirth

80–90%

for help getting someone back to bed, people stuck in lifts, assistance calls

Share of missions ending in refused transport, by reason for the call Bar chart of reasons for ambulance calls ordered by the share of missions where the patient refuses transport, rising from near zero for time-critical emergencies to about 0.9 for help getting a person back to bed, people stuck in lifts and assistance calls.
Reasons for the call appearing at least 1,000 times; one observation per patient. Labels in Italian, e.g. riallettamento = getting a person back to bed, ascensore = stuck in a lift, ausilio = assistance.

So whatA large share of calls signal social and care needs rather than emergencies. Mapping who calls, for what and where shows which local services are missing, such as home assistance, lifting teams or community nursing, and frees ambulances for the patients who need them.

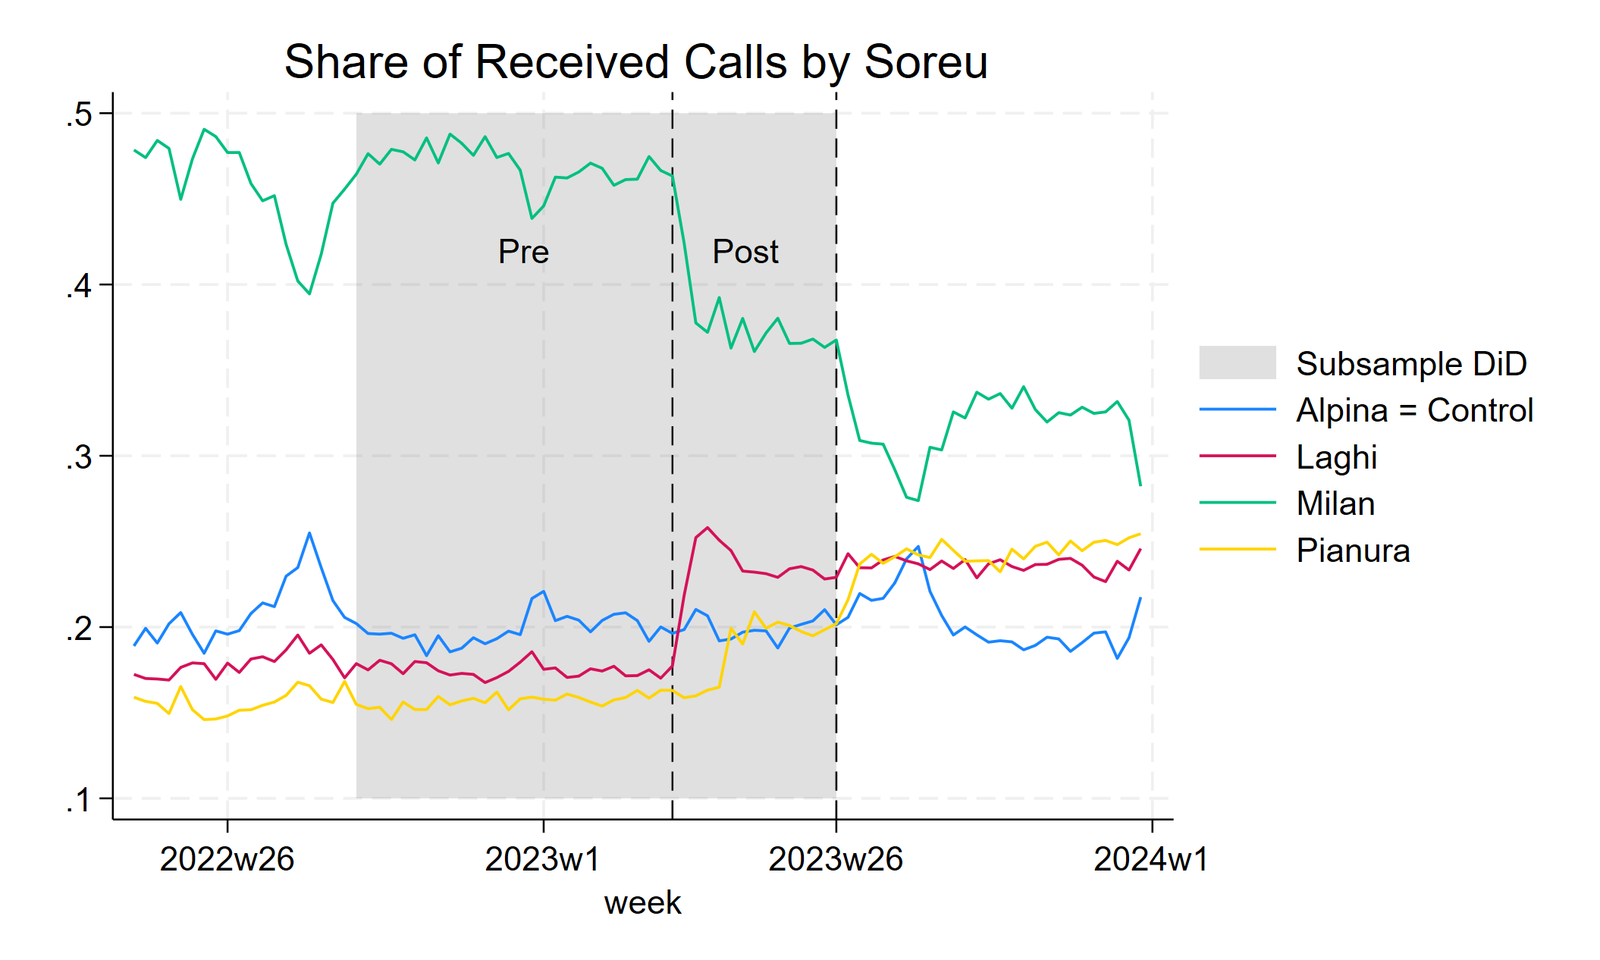
Lombardy's emergency calls are handled by four regional dispatch centres. In 2023 part of the Milan area was reassigned to the Laghi and Pianura centres, while the Alpina centre was unaffected. This sudden shift in workload works as a natural experiment: with Alpina as a control group, it is possible to measure how call pressure affects operators and the service, from calls per operator to call handling time, errors and the time for the ambulance to reach the patient.

−13%

incoming calls in Milan after the restructuring

+19%

incoming calls in Laghi (+8% in Pianura)

−6%

time from call to ambulance on scene in Milan; +2% in Pianura

Share of calls received by each dispatch centre, by week Weekly share of emergency calls received by the four Lombardy dispatch centres, 2022 to 2024. In spring 2023 Milan's share drops from about 0.47 to about 0.37, Laghi's rises from about 0.17 to about 0.25 and Pianura's rises later; Alpina, the control group, stays around 0.2. The grey band marks the pre and post periods used in the analysis.
Grey band: the pre and post weeks used in the difference-in-differences analysis. Estimates control for the number of operators, week and centre fixed effects.

So whatHow calls are split across dispatch centres is a management decision with measurable effects: lighter load means faster response, heavier load slows it. Redrawing territories should be planned together with staffing, and evaluated on the KPIs that matter to patients.

Which emergency workers are most at risk of burnout and secondary traumatic stress? I analysed the Professional Quality of Life (ProQOL) survey of the regional emergency system, covering physicians, nurses, rescuers and drivers, and dispatch operators, both employees and volunteers.

What predicts burnout and trauma · multiple regression
FactorOutcomeEffect
Doctors and nurses (vs. other roles)Burnout+0.139***
Doctors and nurses (vs. other roles)Overall distress index+0.284**
Years of service (log)Burnout+0.071**
Women (vs. men)Secondary traumatic stress+0.150***

Controls for gender, age, experience, contract type and role. Robust standard errors; ** p<0.05, *** p<0.01.

So whatPrevention should target clinical staff and experienced workers first, with dedicated support for secondary trauma.